
1. Credit Management
At the top of the page, you can monitor your resource usage in real-time:- Credit Balance: Displays your remaining credits versus your total monthly allowance (e.g., “1946 of 2000 credits left”).
- Usage Tracker: Shows the total credits used in the current billing cycle to help you manage your budget.
2. Initiating & Scheduling
Two primary actions allow you to control when data is gathered:- New Run: Manually trigger an immediate analysis of your prompts across selected models and countries.
- Schedule: Set up automated, recurring runs to ensure your dashboard data remains fresh without manual intervention.
3. Run History Table
The history table provides a granular audit trail of every analysis performed for your project.| Column | Description |
|---|---|
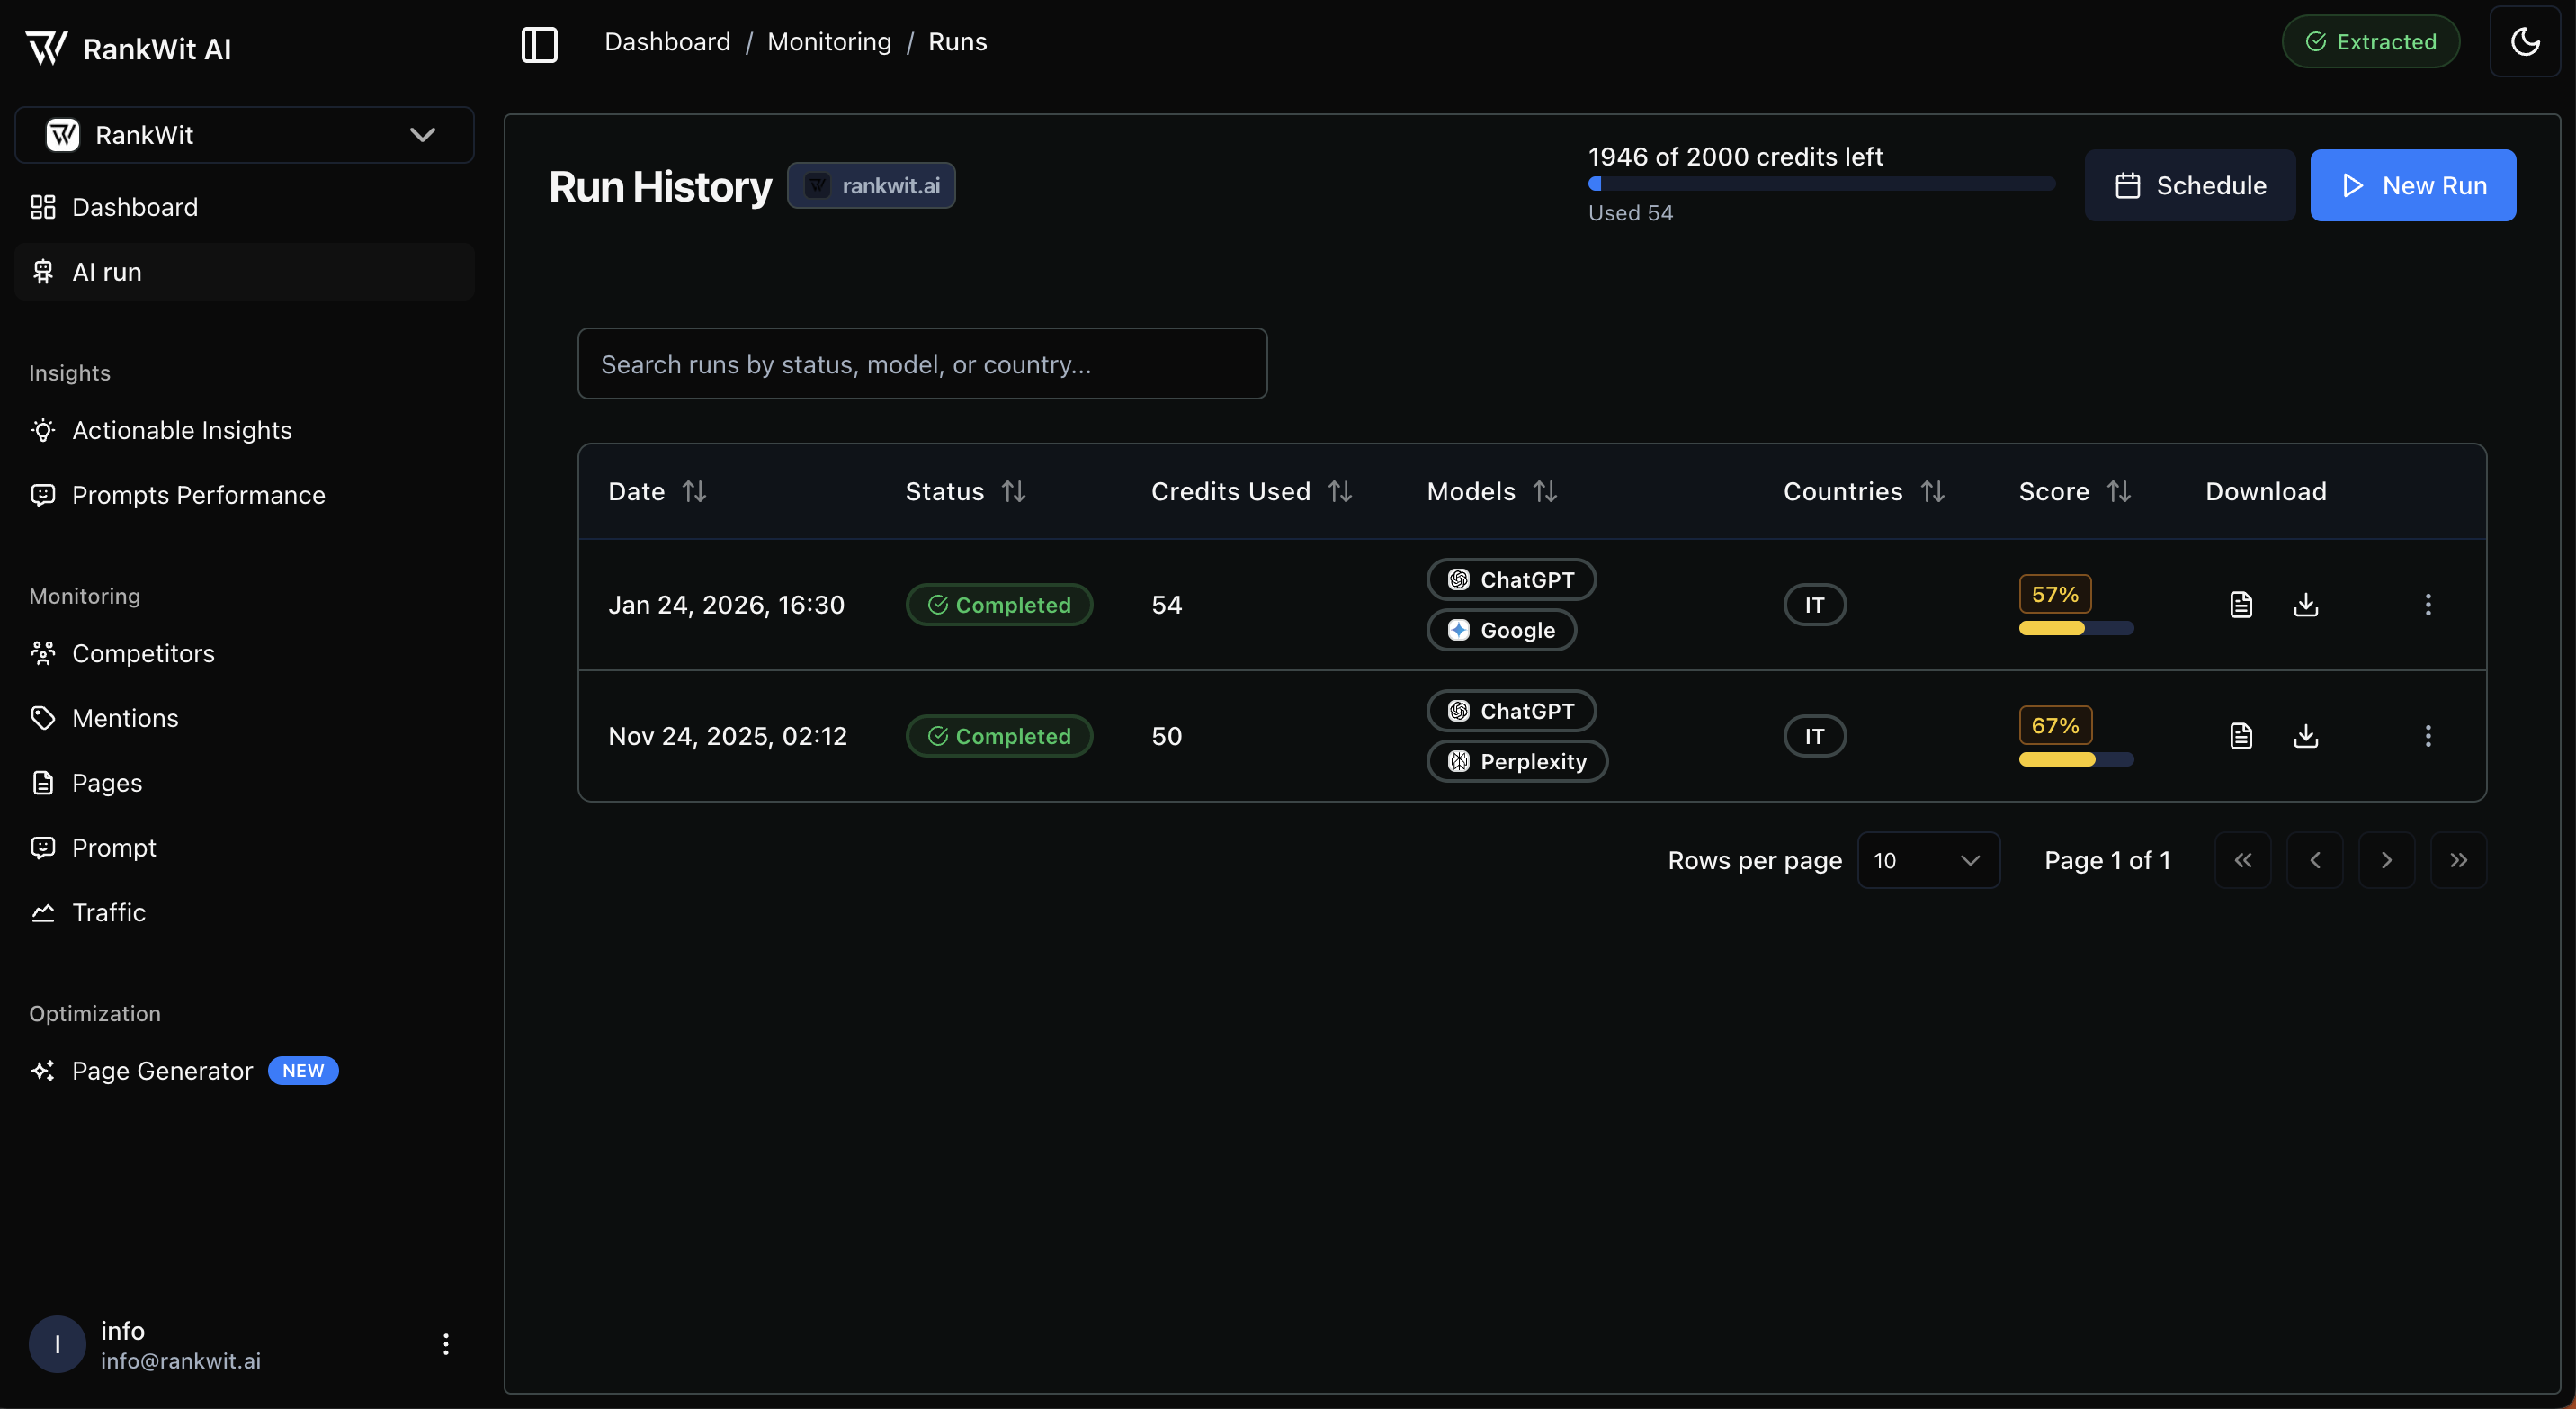
| Date | The exact timestamp when the analysis was initiated. |
| Status | Shows the current state of the run (e.g., Completed, Pending, or Failed). |
| Credits Used | The exact number of credits consumed for that specific session. |
| Models | Icons representing the AI engines analyzed (e.g., ChatGPT, Google, Perplexity). |
| Countries | The geographic location used for the search (e.g., IT for Italy). |
| Score | The final performance Subjective Impression Score generated for that specific run. |
| Download | Quick-action icons to export the results as a report PDF or CSV raw data file. |
4. Searching and Filtering
As your history grows, you can use the Search Bar to quickly locate specific data points:- Filter by Status to find failed or pending runs.
- Filter by Model to compare performance between different AI engines.
- Filter by Country to track regional performance trends.